

Key Performance Indicator Cards


Our KPI Cards are tailored to aid in AI Opportunity Mapping, providing a clear and concise overview of essential business metrics.
They help in identifying and understanding key KPIs, crucial for measuring the effectiveness of AI strategies. These cards ensure that your AI initiatives are aligned with specific business goals, facilitating informed decision-making.

Waste Reduction Rate
This KPI tracks the effectiveness of waste reduction initiatives, calculated by comparing waste quantities before and after improvements. It's vital for sustainability efforts and operational efficiency.
(Waste Before Improvements - Waste After Improvements) ÷ Waste Before Improvements × 100 = Result (%)

Energy Efficiency Improvement
This KPI assesses the reduction in energy consumption as a result of efficiency improvements. It's crucial for understanding the impact of energy-saving measures and sustainability initiatives.
(Energy Consumed Before Improvement - Energy Consumed After Improvement) ÷ Energy Consumed Before Improvement × 100 = Result (%)

Time to Market for New Products
This KPI measures the duration from product conceptualization to market launch. It's key for assessing a company's efficiency in product development and speed to market.
Time from Product Conceptualisation to Market Launch = Result (Days or Months)

Maintenance Cost (MC) Reduction
This KPI evaluates the effectiveness of maintenance cost reduction strategies. It's essential for cost management and ensuring the longevity and efficiency of equipment and processes.
(Maintenance Costs Before Reduction - Maintenance Costs After Reduction) ÷ Maintenance Costs Before Reduction × 100 = Result (%)
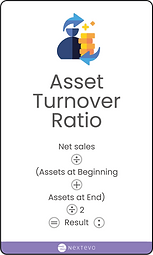
Asset Turnover Ratio
This KPI measures how effectively a company uses its assets to generate sales, a key indicator of operational efficiency and asset utilisation.
Net Sales ÷ (Assets at Beginning + Assets at End) / 2 = Result (Ratio)

Quality Index
This KPI assesses the proportion of products that meet quality standards out of total production. It's crucial for monitoring product quality and ensuring customer satisfaction.
(Number of Units Meeting Quality Standards ÷ Units Produced) × 100 = Result (%)

Process Optimisation Impact
This KPI measures the improvement in performance metrics as a result of process optimisation. It's key for evaluating the effectiveness of process improvements and operational enhancements.
(Performance Metrics After Optimisation - Performance Metrics Before Optimisation) ÷ Performance Metrics Before Optimisation × 100 = Result (%)

Process Improvement Effectiveness
This KPI evaluates the effectiveness of process changes by comparing performance improvements post-implementation with the performance before changes. It's vital for assessing continuous improvement initiatives.
(Performance Improvement After Process Changes ÷ Performance Before Changes) × 100 = Result (%)

Cost Reduction in Operations
This KPI tracks the percentage reduction in operational costs resulting from cost-saving measures. It's significant for financial management and operational efficiency.
(Operational Costs Before Reduction - Operational Costs After Reduction) ÷ Operational Costs Before Reduction × 100 = Result (%)

Workflow Automation Impact
This KPI measures the impact of automation on manual tasks, providing insights into the efficiency gains and time savings achieved through automating workflows.
(Hours Spent on Manual Tasks - Hours Spent After Automation) ÷ Hours Before Automation × 100 = Result (%)